
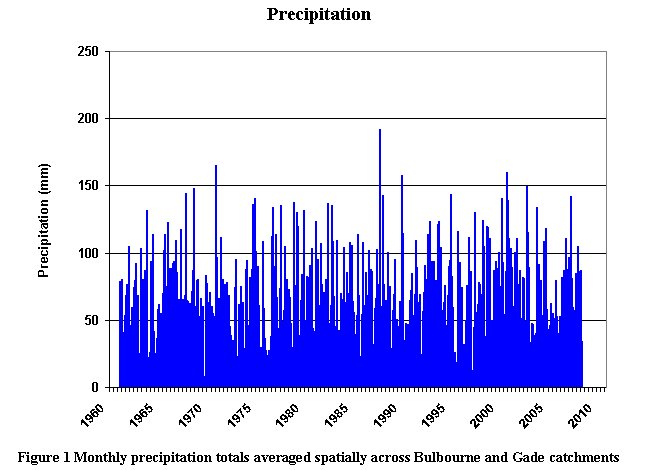
Figure 1 shows the seasonal and annual variability of monthly precipitation across the Hemel Hempstead and Berkhamsted areas. Patterns are difficult to identify because of the variability although the continuous low periods of precipitation during the early 1990s are evident as are the higher rainfalls at the start of the new millennium. Much of the discussion on climate change has focused upon temperature increases due to global warming although precipitation (includes rainfall, snow, dewfall etc) is more important for freshwater resources. There is scientific consensus that Europe is facing future wetter winters and drier summers, but at the detailed local level there are departures from this pattern. More detailed forecasts (at spatial scales below regional level) are available from the UK Climate Impacts Programme (UKCIP) http://www.ukcip.org.uk/ , which demonstrate drier summers in the UK would have a north-south gradient with desiccation greatest in the south, while increases in winter rainfall would have a slight West-East gradient with highest rises to the East. UKCIP further note that winter increases could be of the order of 30% while summer decreases could be around 50% of current values.
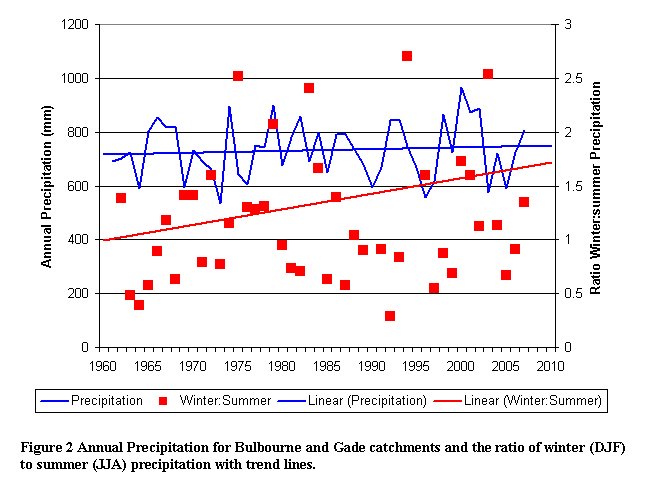
Figure 2 shows a slight increase in annual precipitation since the 1960s but the trend line is a weak fit i.e. does not account for much of the variability in the data. The ratio of winter to summer rainfall also shows an upward trend i.e. winters are getting wetter in comparison to summers but note that there is increasing variability in this ratio and the trend line is again a weak fit to the data. (for information the calculation of the W:S ratio for 1961 is based upon December 1960 with January and February 1961, compared to June, July and August 1961, and so on; a ratio of 1.0 means winter precipitation equals summer whereas a ratio of 1.5 means winter precipitation is 50% more than summer). For comparison the ratio of winter to summer precipitation at Rothamsted experimental station (near Harpenden), which is one of the longest records in the area, was at unity i.e. a ratio of 1.0 over a hundred years ago but has steadily risen to around 1.3 by the end of the 20th Century. Figure 2 shows that much higher ratios can be observed in any one year revealing the impacts of drier summers at some times. This supports the predictions from global warming forecasts (see Meteorological Office web pages at,http://https://www.metoffice.gov.uk/climate-guide/climate-change/resources/hadleycentre ) that more extreme rainfalls are expected with more frequent droughts while at other times high intensity storms will be more common raising concerns over increased flood risk.
It is changes in extreme values that will have the greatest impact. The IPCC (Inter Governmental Panel on Climate Change) recently (2007) presented their Fourth Assessment http://www.ipcc.ch/ in which they conclude that by 2050 river runoff is expected to increase 10-40% in higher latitudes i.e. Europe. Precipitation extremes will increase leading to more droughts, and more floods but it is difficult to predict daily rainfall totals 25 days ahead never mind 25 years into the future. Furthermore rainfall amount alone does not provide a full picture as a milder winter with more days of rain can be expected to result in a modest increase in the magnitude of floods in the UK whereas warmer conditions with more convective storms may have a much greater impact on the magnitude of the largest floods.
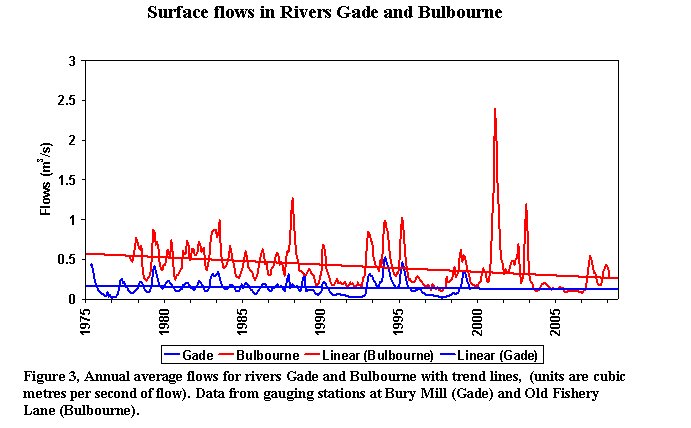
Figure 3 shows that the rivers Bulbourne and the Gade have experienced high and low flows over the last 30 years but the trend lines for both rivers are negative. There is some evidence that low flows are becoming more persistent and flows in general are becoming more unpredictable with very high discharges at the turn of the 20th Century. Care needs to be exercised in the analysis of these data as both rivers are subject to artificial manipulation by human induced changes in the catchment. Flows for the Bulbourne for example are observed at the Old Fishery Lane gauging station and the water discharging at this point has been augmented by inflows from the Grand Union Canal, which is turn has been augmented by effluent from the Berkhamsted Sewage treatment plant. Under global warming we can expect high flows to be higher, and for minimum flows to occur more often hence there is some evidence in figure 3 of the impacts of climate change. But modelling the predicted impacts of climate change upon UK river flows has been most successful in upland areas and has proved to be difficult in these low lying catchments where groundwater is important. 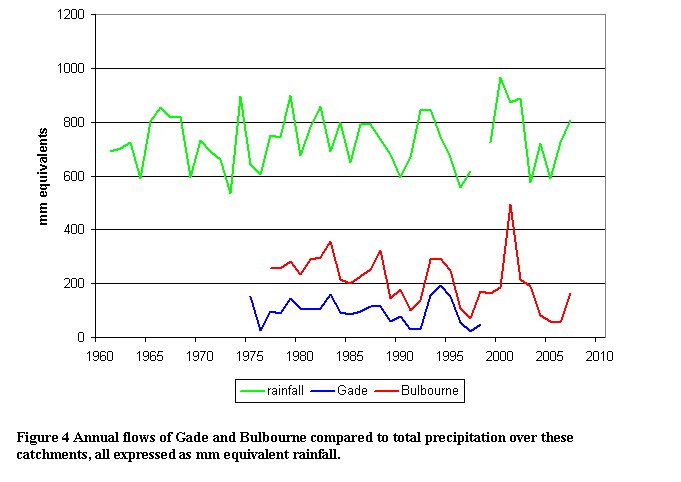
It is noticeable in figure 4 , where annual catchment flows have been divided by their respective catchment areas (48km2 for the Gade and 61km2 for the Bulbourne) to express flows not in m3s-1 but in mm of rainfall equivalent, that only a relatively small proportion of total precipitation leaves these catchments as surface flows. For the Gade, on average 14% of annual precipitation occurs as surface flow monitored at the Bury Mill gauging station, whereas twice as much i.e. 28% of precipitation is recorded at Old Fishery Lane for the Bulbourne, demonstrating the artificial augmentation of flows for the latter.
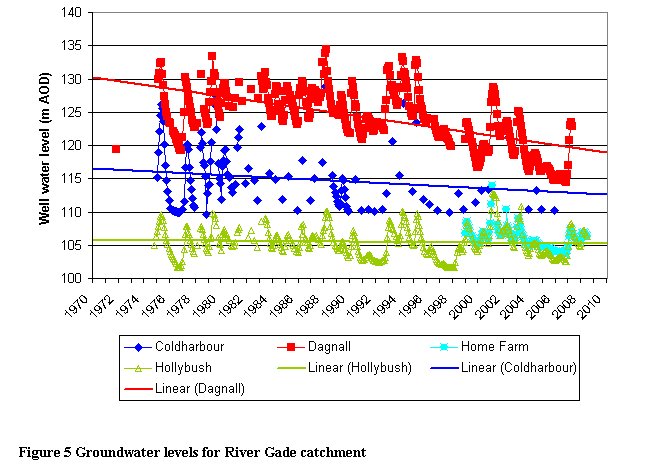
The predictions under climate change presented above might be expected to lower groundwater levels as recharge of the aquifers could be reduced through more persistent summer droughts. However recharge of groundwater in this region typically commences in winter with maximum well levels observed in early spring when the winter rainfalls have had sufficient time to percolate to the water table. If winters are getting wetter (see figure 2), then groundwater recharge rates may actually increase, but this is further complicated by summer droughts creating higher soil moisture deficits. Furthermore groundwater tables are affected by abstractions for drinking water. Figures 5 and 6 display the water levels in selected wells in each of the Gade and Bulbourne catchments.
The wells in the Gade catchment follow a similar pattern. After the major drought of 1976 the water levels recovered with annual peaks showing that winter recharge continues to be effective. Of some concern are the trend lines for all wells which are strongly negative for the Dagnall and Coldharbour sites, less so for Hollybush, with noticeable lower groundwater levels and weaker winter recharge in recent years.
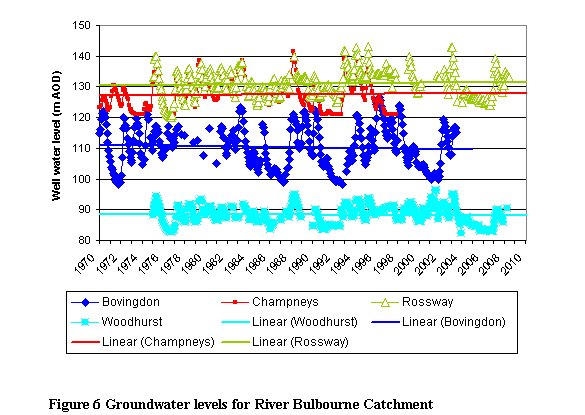
In contrast, the groundwater levels for the Bulbourne catchment shown in figure 6 display modest increases in water level over time. It is noticeable that the well at Bovingdon demonstrates much greater variability than the rest and taken together figures 5 and 6 reveal that the two catchments do not display identical responses to changes in climate. Hydrological conditions across these catchments are more complex and heterogeneous than might have been expected.
Increased drought can be identified by changes in precipitation amount and duration (meteorological drought) but for freshwater resources changes to the soil water balance can be even more significant. It is often assumed that drier summers means that soils will dry out such that there will be less water percolating through to recharge groundwater. Figures 5 and 6 suggests that there is a mixed pattern of responses to changes in precipitation which is to be expected given the high levels of human management of these catchments.
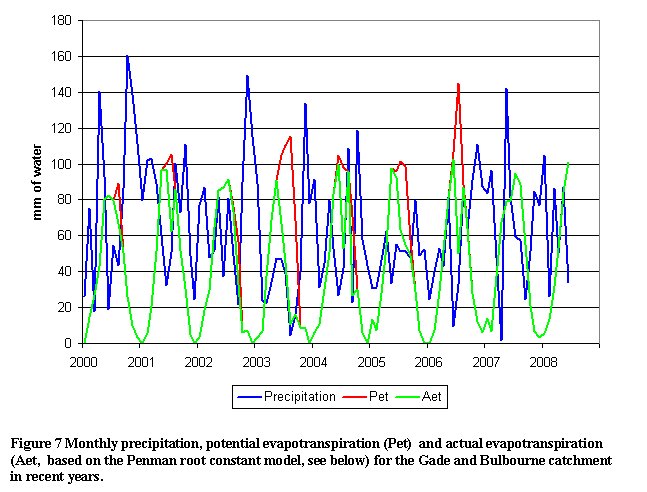
Figure 7 shows that precipitation frequently exceeds the atmospheric demand for water i.e. potential evapotranspiration such that there is excess water for surface runoff and groundwater recharge. The amounts of winter time excess do vary and of course during the summer months there is often insufficient precipitation to satisfy the potential evapotranspiration. During the summer soil moisture reserves are then depleted and if precipitation is too low then actual rates of evapotranspiration will fall below potential rates when soil moisture deficits increase to levels where water is no longer freely available to plants e.g. during the year 2003.
The amount of soil water available to plants (AWC) is normally taken to lie between field capacity (FC, is the upper limit of soil water storage when free drainage has ceased) and crop wilting point (WP, where plants can no longer extract moisture).
AWC = FC - WP (mm of water)
Soil moisture deficits (SMD) occur when soil moisture content (SMC) falls below field capacity with the maximum SMD being AWC. Thus,
SMD = FC - SMC
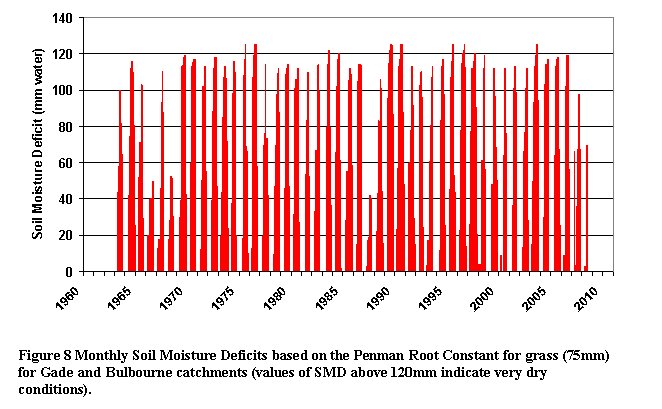
Figure 8 shows SMDs for the Gade and Bulbourne catchments using the Penman root constant (Grindley) approach with a grass root constant of 75mm. It is interesting to note that the maximum SMD of 125mm is frequently reached during summer months. But even in the 1975-1976 drought the SMD is returned to zero by winter precipitation. There is little evidence here of increasing soil desiccation but this is a model prediction for a grass covered soil and where there is deeper rooting than grass e.g. woodland, then the SMD will be greater for the most severe droughts.
There is evidence of increasing variability in seasonal precipitation patterns with the ratio of winter to summer precipitation rising in general and a larger range of ratios observed in recent years. River flows show more persistent low flows but discharges do not respond solely to precipitation inputs. Groundwater patterns are complex with the Gade catchment showing the strongest evidence of recent declines in water table. High soil moisture deficits occur from time to time but there were a number of occasions in the 1990s when desiccation was more frequent. There is then some evidence that the types of hydrological responses expected through global warming induced climate change are being found in the Gade and Bulbourne catchments. Both river systems are however highly managed and are influenced by human induced changes in their catchments e.g. less surface storage, increased storm runoff through urban drainage and the effects of groundwater abstraction so we should not expect a simple relationship between climate change and hydrology.
(NB data courtesy of the Environment Agency)