
Climate change in Dacorum
Global warming - the big picture ...
According to the Intergovernmental Panel on Climate Change (IPCC)’s Fourth Assessment Report, released in February 2007, there has been a marked acceleration in the rate of global warming over the last few decades; out of a 0.74ºC rise in the 100 years from 1906, 0.45ºC has occurred in the last 30 years. These are globally-averaged values which include the slower responding oceans; rates of warming over land will have been much greater, especially over northern hemisphere land areas. It is encouraging to note that the post-1990 increases are in line with earlier IPCC predictions for this period, strengthening confidence in shorter-term projections for the years to come.
.... and here in Dacorum
The projected rates of future warming for UK regions will become clearer by the end of the year when UKCIP, the United Kingdom Climate Impacts Programme, completes its post-processing and down-scaling of the IPCC global data. However we can quantify recent climate change in Dacorum by comparing actual post-1990 temperature trends with values for the standard 1961-1990 averaging period.
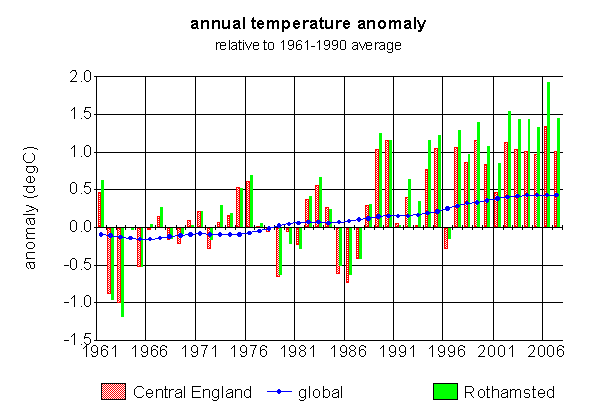
The Chilterns lie within the southern end of a triangular ‘Central England’ area for which there is a long-running temperature record ; in the figure below annual ‘Central England’ temperatures are shown as anomalies relative to the 1961-1990 mean value. An additional bonus for Dacorum is the availability of temperatures for nearby Rothamsted; Rothamsted is one of the stations from which the CET is compiled. Rothamsted annual values are also shown in the figure .
The relative warming since 1990 is striking; only in 1996 did the CET average fall below that for 1961-90 and in the five most recent years it has been 1 degC or more above that average. If we assign the 1961-90 averages to the mid-year of that period (1976) then we are seeing a warming of over 1degC in 30 years, a far more impressive statistic than the global value with which we started ! The anomaly at Rothamsted itself has been consistently higher (i.e. warmer) than the overall CET value since 1992. Note also that 2007, not a year that will be remembered for its summer, was the third warmest year at Rothamsted in a series running from 1916. Global warming does not necessarily mean Mediterranean summers !
Will it be floods? - or droughts?
The one element of climate change which is likely to impact most upon Dacorum is rainfall. The emerging message from previous Intergovernmental Panel on Climate Change (IPCC) assessments for south-east England has been ‘wetter winters and drier summers’. Preliminary indications are that further analysis of the latest (2007) IPCC assessment will reach the same conclusion.
This mantra has become ingrained in the public awareness and sometimes fosters the belief, among general public and media alike, that heavier winter rains will be the answer to our problems, sustaining our threatened chalk stream environments and at the same time meeting increased demands upon water resources for the public supply. Such impressions lead to complacency and are dangerously misleading; the truth may be very different.
There are three problems with the simplistic ‘wetter winters’ story:
· The IPCC ‘winter’ is the three months of December, January and February. In chalk country autumn rains are equally important for they are needed to overcome end-of-summer soil moisture deficits and to satisfy the demands of vegetation before aquifer replenishment can begin ahead of the main midwinter months. From the water resource point of view we need to look at rainfall over the whole 6-month ‘recharge’ period from October to March. This is the water industry ‘winter’.
· Actual rainfall alone is insufficient to specify the availability of water for aquifer recharge. We need to know the ‘effective rainfall’, i.e. that proportion of actual rainfall which penetrates to the aquifer after running the gauntlet of evapotranspiration. As growing seasons lengthen in a warming world more rainfall will be lost to direct evaporation and uptake by plant roots.
· Forecasts of future rainfall are typically presented for successive ‘time-slices’, e.g. 2020, 2050, 2080. These may create the impression of steady increase with time; it becomes tempting to draw a straight line to ‘join up the dots’. British rainfall does not do straight lines – it does zig-zags and wiggles. Inter-annual variability is an enduring and well-recognised characteristic of rainfall in Britain and is likely to remain so. Increasing winter rainfall overall does not preclude multi-seasonal droughts such as we have seen so recently.
Proof of the pudding
IPCC predictions are expressed relative to the standard averaging period 1961-1990. In the same way we can compare post-1990 observed values for the Chilterns with those for the standard period and hence see what has actually happened so far (see table).
| Chilterns East
(covering Dacorum) |
Changes from 1961-1990
to 1991-2007 |
||
| rainfall | effective rainfall | ||
| percentage change | |||
| year | jan-dec | 3.2 | 2.9 |
| winter | oct-mar | 6.5 | 5.7 |
| midwinter | dec-feb | 4.8 | 8.9 |
| transitional | oct, nov, mar | 9.2 | 0 |
| summer | apr-sep | - 0.1 | - 4.3 |
Important points to note are:
· rainfall increases in all seasons except summer,
· a greater increase over the 6-month water industry ‘winter’, mostly attributable to the late-autumn/early-spring months where the increase was ~9%,
· but only in the midwinter period has percentage effective rainfall increased more than actual rainfall.
· specifically, in the transitional months (including October and November), in spite of rainfall increasing by 9%, effective rainfall was unchanged. This phenomenon is particularly marked following hotter summers when vegetation demands extend into autumn; after the 2003 record summer, although October/November rainfall was about 90% of average effective rainfall was only 30% and in 2006 although October/November rainfall was 47% above average, the increase in effective rainfall was a mere 10%.
· most importantly, although there was a general increase in winter period rainfall with time, this 17-year period will be remembered for two serious droughts, 1995-1997 and 2004-2006, attributed to the occurrence of consecutive dry winters.
Final comments:
o The increased autumn rainfall since 1990 is at odds with the 2002 IPCC projections of decreasing rains over this season. Nevertheless the observed excess has not been translated into an increase in effective rainfall; the lengthening growing season appears to be narrowing the aquifer recharge window already.
o In spite of any underlying trends, the inherent natural variability of the English climate remains dominant. We should not be lulled into the impression that all winters will be wet. We are not finished with droughts just yet!
Author: John Norris